Explore our tools and web services and learn how to include them in your applications
More Info
The Analysis Web-Service is token based, so for every analysis request a TOKEN is associated to the result. From this moment on, the results can be accessed via the API “token” method in order to retrieve more detailed information. Taking advantage of the token produced during every analysis, it is possible to link back to the PathwayBrowser and browse the results overlaid on either the pathways overview or a selected pathway.
As mentioned afore, Reactome provides an overrepresentation analysis, an expression data analysis and a species comparison tool. For overrepresentation and expression analysis, the service can automatically detect which one to perform depending on the format of the submitted data (see Table 1). If the data contains expression values in a tab-separated-values (TSV) format, then the expression analysis will be executed, otherwise the overrepresentation analysis is the executed one.
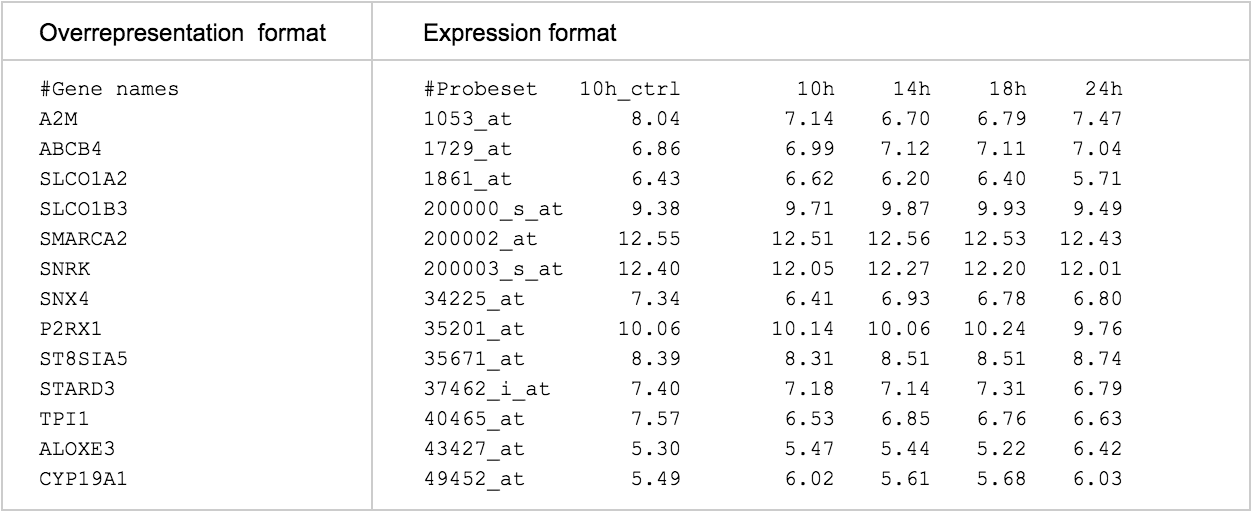
Data must be submitted in a format that includes a first row of column headers. The header for column 1 must start with the # symbol. Column 1 must contain protein, compound or other suitable identifiers, such as OMIM IDs. Identifiers can only be placed in column 1. A one-column file is sufficient for pathway over-representation analysis. For expression analysis, columns 2 and onwards must contain numeric values, with no alphabetical characters. Decimals must use the full stop (period) symbol, not commas. Columns must be tab-delimited (this format is an option when saving from most spreadsheet programs such as Excel).
The first line must start with “#” to indicate the name of the sample (first column) and the names of each expression column when expression data is submitted. Please note that while this line is optional for the overrepresentation format, it is mandatory for the expression data format, because the name of each column needs to be provided. It is recommended though to have this first line defined in the submitted data, so later on it is easier to identify what kind of experiment the data is related to.
Every other line starts with the identifier of the gene/protein/chemical. For expression analysis, the rest of the columns should contain numbers corresponding to the expression values.
Data Submission
The first use case would be when the data to be analysed is submitted using the method:
https://reactome.org/AnalysisService/identifiers/
In this case the data must be sent via POST (please refer to the API documentation for more details) so the analysis will be performed against the Reactome database content.
A second use case is when a text flat file containing the data to be analysed (in the specified format mentioned afore) is sent. In this case the method to be used is:
https://reactome.org/AnalysisService/identifiers/form/
A third use case would be when the data to be analysed is accessible through the Internet. In this case, there is a specific method that indicates to the analysis service where to get the data:
https://reactome.org/AnalysisService/identifiers/url/
Please note all these methods have an option to project the identifiers to human and only show the result in this species (by adding the “projection/” suffix to any of them). Please refer to the API documentation for more details.
Analysis result handling
Once the analysis is finished, the result is sent back to the user in json format (please refer to the API documentation for more details). One of the fields in the analysis summary object is called “token”. The particular analysis result is associated to this token and it can be retrieved later on using the following method without having to send the same data again:
https://reactome.org/AnalysisService/token/
Reactome ensures that the token will be available for the 7 next days after the analysis. After this period it goes into an LRU queue, so may be available for longer but this cannot be ensured as it depends on the frequency of its usage.
The “pathways” field in the analysis result contains a list of the most significant pathways with the corresponding statistics results. By default, these pathways are sorted from the most to the least significant, so the first item would be the most statistically significant. However the user is advised to take into account the statistical values (pValue and FDR) and also the results coverage in the pathway, indicated by entities and reactions found.
Linking back to Reactome Pathway Browser
If linking back to Reactome to visualise the results is required, there are two methods. Providing the token is enough to link back to the PathwayBrowser and get the Fireworks results overlay view. To do so please replace {TOKEN} in the following URL by the one provided in the result.
https://reactome.org/PathwayBrowser/#DTAB=AN&ANALYSIS={TOKEN}
To build a link back pointing to a specific pathway to overlay the result on its diagram, please replace {ST_ID} by the pathway stable identifier (provided in the analysis result for each pathway) and {TOKEN} by the one provided in the result.
https://reactome.org/PathwayBrowser/#{ST_ID}&DTAB=AN&ANALYSIS={TOKEN}
Get Started
OK! You’ve reached this far :) so let’s see how to start using the analysis service.
There are two ways to submit your sample of identifiers for analysis. The first method is to POST all the identifiers (or the file containing them). The second involves letting the analysis service know where the sample is by providing its URL. Many types of identifiers that can be submitted, including UniProt, chEBI, Ensembl, miRBase, GenBank/EMBL/DDBJ, RefPep, RefSeq, EntrezGene, OMIM, InterPro, Affymetrix, Agilent, Compound, Illumina, etc. Please get in touch with our This email address is being protected from spambots. You need JavaScript enabled to view it. if your sample identifiers are not supported.
In the following examples we use curl to query the analysis service from the command line. They show how to send some gene names (PIK3C2A, PTEN and UNC5B) to be analysed and also how to provide the location of your data via the url interface.
The simplest approach is to send your gene names via POST to the https://reactome.org/AnalysisService/identifiers/projection method.
curl -H "Content-Type: text/plain" -d "$(printf '#Genes\nPIK3C2A\nPTEN\nUNC5B')" -X POST --url https://reactome.org/AnalysisService/identifiers/projection/\?pageSize\=1\&page\=1
For long lists, the previous example might be impractical. A more convenient way is to POST the content of a file containing the sample to be analysed. Let’s assume you have a file called genes.txt that contains the following set of genes to be analysed:
#Genes
PIK3C2A
PTEN
UNC5B
The command changes to indicate that the data is now taken from the file (but please note that the method of the analysis service remains the same):
curl -H "Content-Type: text/plain" --data-binary @genes.txt -X POST --url https://reactome.org/AnalysisService/identifiers/projection/\?pageSize\=1\&page\=1
Both of the previous commands will produce the result shown in Figure 1

Let’s focus on the retrieved pathways list. It only contains one pathway because in the command we have specified \?pageSize\=1\&page\=1 and that forces the analysis to provide ONLY the most significant pathway for the submitted data. If you want the first 10 results, the way of doing it would be \?pageSize\=10\&page\=1. To see the results from 11 to 20 use \?pageSize\=10\&page\=2. The reason for this paging mechanism is to avoid overloading the client with the full set of results. Here we are querying from the command line and probably the memory usage isn’t an issue, but please consider web-clients. Important note: If pageSize and page are not specified, then the whole set of results is retrieved to the client.
Other important fields in the result are pathwaysFound, identifiersNotFound, summary.token and summary.type. The first two are self-descriptive, so let’s focus on the summary. As already mentioned, the summary.token can be used to retrieve the results of a previously performed analysis without the need to submit the sample again. For example, the results of the previous analysis can be easily accessed by simply calling the https://reactome.org/AnalysisService/token method and providing the token.
curl https://reactome.org/AnalysisService/token/MjAxNTEwMjAwNjU0MDBfMzMw\?pageSize\=1\&page\=1
As illustrated in Figure 2, the analysis service provides a thorough collection of token-based methods that can be used to access the results of a previously performed analysis.

The summary.type provides information about the type of the analysis performed and it can be OVERREPRESENTATION, EXPRESSION or SPECIES_COMPARISON.
Every item in the pathways array, contains information about a specific pathway, i.e its name, stable identifier, the species it belongs to, the number of entities matching the submitted sample etc. pValue and fdr show the significance of the pathway as the result of the analysis.
Pointing to your resource as data provider for the analysis
Let’s suppose that you have some data to be analysed on your server and you want to point Reactome analysis to retrieve it directly. We use PRIDE data for our examples. More specifically we analyse PRIDE data stored in https://www.ebi.ac.uk/pride/ws/archive/protein/list/assay/27929.acc. This can be done by using the /identifiers/url methods:
curl -H "Content-Type: text/plain" -d "https://www.ebi.ac.uk/pride/ws/archive/protein/list/assay/27929.acc" -X POST --url https://reactome.org/AnalysisService/identifiers/url/projection/\?pageSize\=1\&page\=1
Just POSTing the URL, where the data is, to the https://reactome.org/AnalysisService/identifiers/url/projection/ method is enough to perform the analysis. The rest of the parameters work exactly as explained above. It is also important to take into account that URLs sent to this method can either be HTTP or HTTPS, if your service uses secure HTTP, we can deal with it ;).
I have a JavaScript client. How do I query your service?
First we will create a simple HTML page with one button and a place holder to show a table with the results of the query. Please note we have included the jQuery library.
<html>
  <head>
	<title>Connection to the Reactome Analysis Service</title>
	//We are using jQuery for this example
	<script src="//ajax.googleapis.com/ajax/libs/jquery/1.11.2/jquery.min.js"></script>
	<script type="text/javascript">
		//Here is where we are going to include the magic
	</script>
  </head>
  <body>
	<h1>Connection to the Reactome Analysis Service</h1>
	<p>Please click the button to execute the analysis:</p>
	<button id="analyseURL">Analyse data</button>
	<br> <br>
	<div id="resultsHolder"></div>
	<div id="errorHolder" style="color:red"></div>
  </body>
</html>
As you can see in the Figure 3, the resulting page is quite a simple one, but enough for our get started purposes.

The next step is to write the code that connects to the analysis service and presents the data back to the client. Please note that we will use the /identifiers/url/projection method in order to request the analysis of data stored in the PRIDE repository.
<html>
  <head>
	<title>Connection to the Reactome Analysis Service</title>
	<script src="//ajax.googleapis.com/ajax/libs/jquery/1.11.2/jquery.min.js"></script>
	<script type="text/javascript">
		$( document ).ready(function() {
			$("#analyseURL").click(function() {
				// The URL of the analysis method
				var reactomeURI = 'https://reactome.org/AnalysisService/identifiers/url/projection?pageSize=20&page=1';
				// The URL of our sample to be submitted for analysis
				var dataUrl = "http://www.ebi.ac.uk/pride/ws/archive/protein/list/assay/27929.acc";
				// Perform the ajax call to the analysis service
				jQuery.ajax({
					type: "POST",
					url: reactomeURI,
					data: dataUrl,
					headers: {
						"Content-Type": "text/plain"
					},
					dataType: "json"
				}).success(function (data, textStatus) {
					if (textStatus === 'success') {
						var table = "<table width='100%'><tr><td>Name</td><td>pValue</td><td>FDR</td></tr>";
						$.each(data.pathways, function(num, pathway){
							table += "<tr><td><a href='https://reactome.org/PathwayBrowser/#/"+  pathway.stId +"&DTAB=AN&ANALYSIS=" + data.summary.token +"'>" + pathway.name + "</a></td><td>" + pathway.entities.pValue + "</td><td>" + pathway.entities.fdr + "</td>";
						});
						table += "</table>";
						$("#resultsHolder").append(table);
					} else {
						$('#errorHolder').text('An error occurred');
					}
				}).error(function (data, status, headers, config) {
					$('#errorHolder').text(status + ": " + headers);
				});
			});
		});
	</script>
  </head>
  <body>
	<h1>Connection to the Reactome Analysis Service</h1>
	<p>Please click the button to execute the analysis:</p>
	<button id="analyseURL">Analyse data</button>
	<br> <br>
	<div id="resultsHolder"></div>
	<div id="errorHolder" style="color:red"></div>
  </body>
</html>
Quickly analysing the main parts of the JavaScript code body, we see two main methods: $( document ).ready and jQuery.ajax. The first one ensures the content of the associated callback function will be executed when all the HTML is fully loaded in the DOM. The second is responsible for performing the analysis request against Reactome’s analysis service.
Focusing on the .success function in the ajax query, we see how the results for a “success” connection with a “success” response are handled (please note that a success connection differs from a success response, since there can be different reasons why a success connection can end up retrieving an error, i.e. data content is not in the right format). The results can be accessed within the data object passed to the .success(function(data, textStatus){…}) method following the format shown in Figure 1.
In the example, a table is created with the retrieved set of pathways (Figure 4). Each row of the table contains the pathway name, the pValue and the FDR. It’s also important to see how we’ve built the hyperlink from the name to the view of the pathway (with the analysis result overlay) directly to the Pathway Browser. Please note that it is also possible to link to the Pathway Browser in order to show the general result overlaid on the pathways overview. The link for this is:
https://reactome.org/PathwayBrowser/#/DTAB=AN&ANALYSIS={TOKEN}

But this example doesn’t look pretty! Yes, we know but we are explaining how to access Reactome data. Please have a look to the CSS documentation and start learning how to apply the styles to make the look fit with your expectations.